使用Echarts的总结
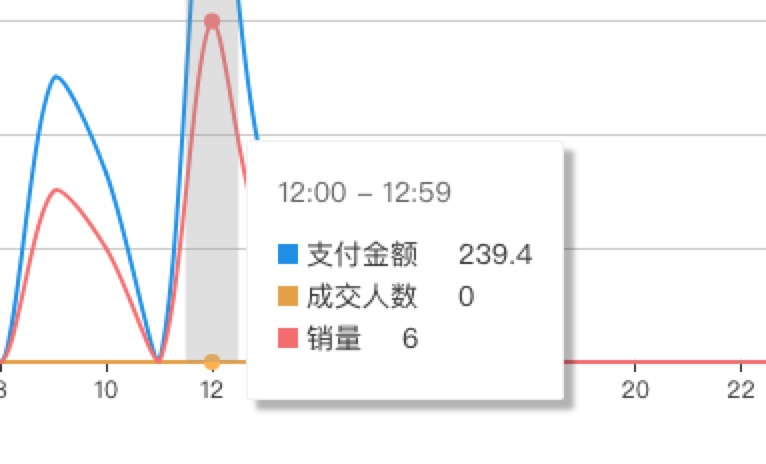
1、tooltip的使用:
1 | |
上述代码的展示效果为:
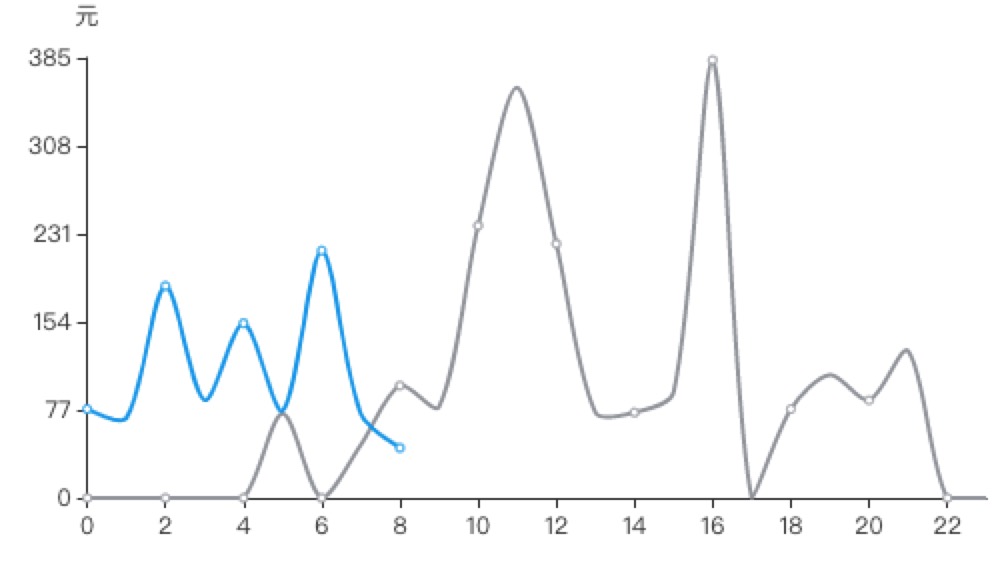
2、取消y轴横线展示:
1 | |
上述代码的展示效果为:
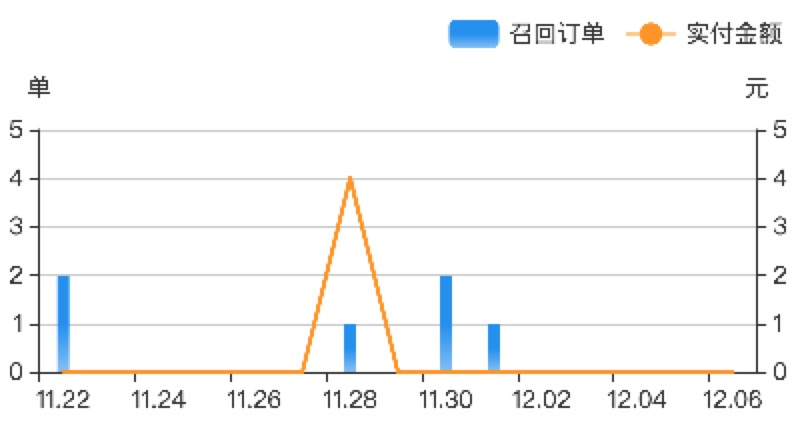
3、折线和柱状图同时展示:
1 | |
上述代码的展示效果为:
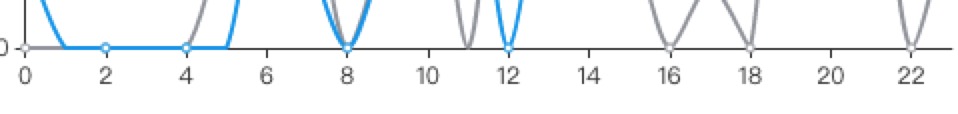
4、横坐标隔一个显示:
1 | |
上述代码的展示效果为:
5、直方图:
**这里有个非常重要的问题,官方的echarts-stat npm包存在一些缺陷,比如数据都是0或者其他数据会报错:
1 | |
RangeError是当一个只超出有效范围时发生的错误。
主要的有几种情况,第一是数组长度为负数,第二是Number对象的方法参数超出范围,以及函数堆栈超过最大值。
1)数组长度为负数
1 | |
2)Number对象的方法参数超出范围
1 | |
查看源码,发现是toFixed的参数为负数,因此调整npm包,引入echarts-stat-tofixed npm包,或者用cdn https://echarts.baidu.com/examples/vendors/echarts-stat/ecStat.min.js?v=1553896255267
1 | |
6、K线图:
1 | |
参考文档: Echarts Demo